Burn-up vs Burn-down Charts
Both charts plot progress against time and they differ in one structural way that decides what each can conceal. A burn-down has a single line falling towards zero: work remaining. A burn-up has two, one rising as work is completed and one showing the total amount of work there is to do, which moves whenever scope moves.
Section 5 of the PMBOK® Guide Eighth Edition includes charts of this kind among the techniques available for tracking and communicating progress, and the choice between them is mostly a question of whether your total is genuinely fixed.
What each line shows
The burn-down answers how much is left. It is compact, easy to read at a glance, and ideal inside a short cycle where the scope was agreed at the start and will not change. Its weakness is that a single line has to carry two different movements: work completed pushes it down, and work added pushes it up, and the chart shows only the net result.
The burn-up answers two questions at once. The completed line shows delivery, the total line shows scope, and the gap between them shows what remains. Nothing can hide: a fortnight in which the team finished a great deal and the scope grew by the same amount produces a rising completed line and a rising total, which is a completely different picture from a team that stalled.
Three readings people get wrong
A flat burn-down does not mean nothing happened. It means as much arrived as departed, and the two causes need opposite responses: a stalled team needs help, and a growing scope needs a conversation with whoever is adding to it. Teams get blamed for the second one regularly, because the chart offers no way to tell the difference.
A line that meets zero does not mean the work is finished. It means the measured units reached zero, and if some of those units were completed by being removed from the list, the chart is describing a bookkeeping event. This is worth checking whenever a burn-down improves sharply in its final third.
A steep late drop is usually accounting, not delivery. Work reported as done in a rush at the end of a period tends to be work that was substantially complete for a fortnight and unreported, and the chart's shape has told you more about reporting habits than about progress. Charts built on items that finish in small pieces are more honest than charts built on a few large ones for exactly this reason.
Two thousand tags that became three
An infrastructure project was commissioning a major water treatment upgrade, and tracked commissioning progress by tagged items: valves, instruments, motors, each requiring a test and a signature. The programme reported a burn-down of outstanding tags to the client each fortnight.
For four months the line fell steadily. Then it flattened, for six weeks, while the commissioning teams worked at the same rate they always had. The client's assumption, stated at a progress meeting, was that commissioning had run into difficulty.
It had not. The tag list had grown twice: once when a late design change added a dosing skid with about a hundred and forty tags, and once when the client's own operations team asked for functional testing on items that had been outside the original list. Both were legitimate, both had been agreed in principle by somebody, and neither had been visible on a chart whose only line was work remaining.
The programme switched to a burn-up the following fortnight. The completed line had never flattened; it had continued to rise at very nearly the same gradient throughout. The total line had two clear steps in it, one in each of the months when scope had been added. The conversation at the next meeting was about who had agreed the second step and what it was worth, which was the conversation that should have happened eight weeks earlier.
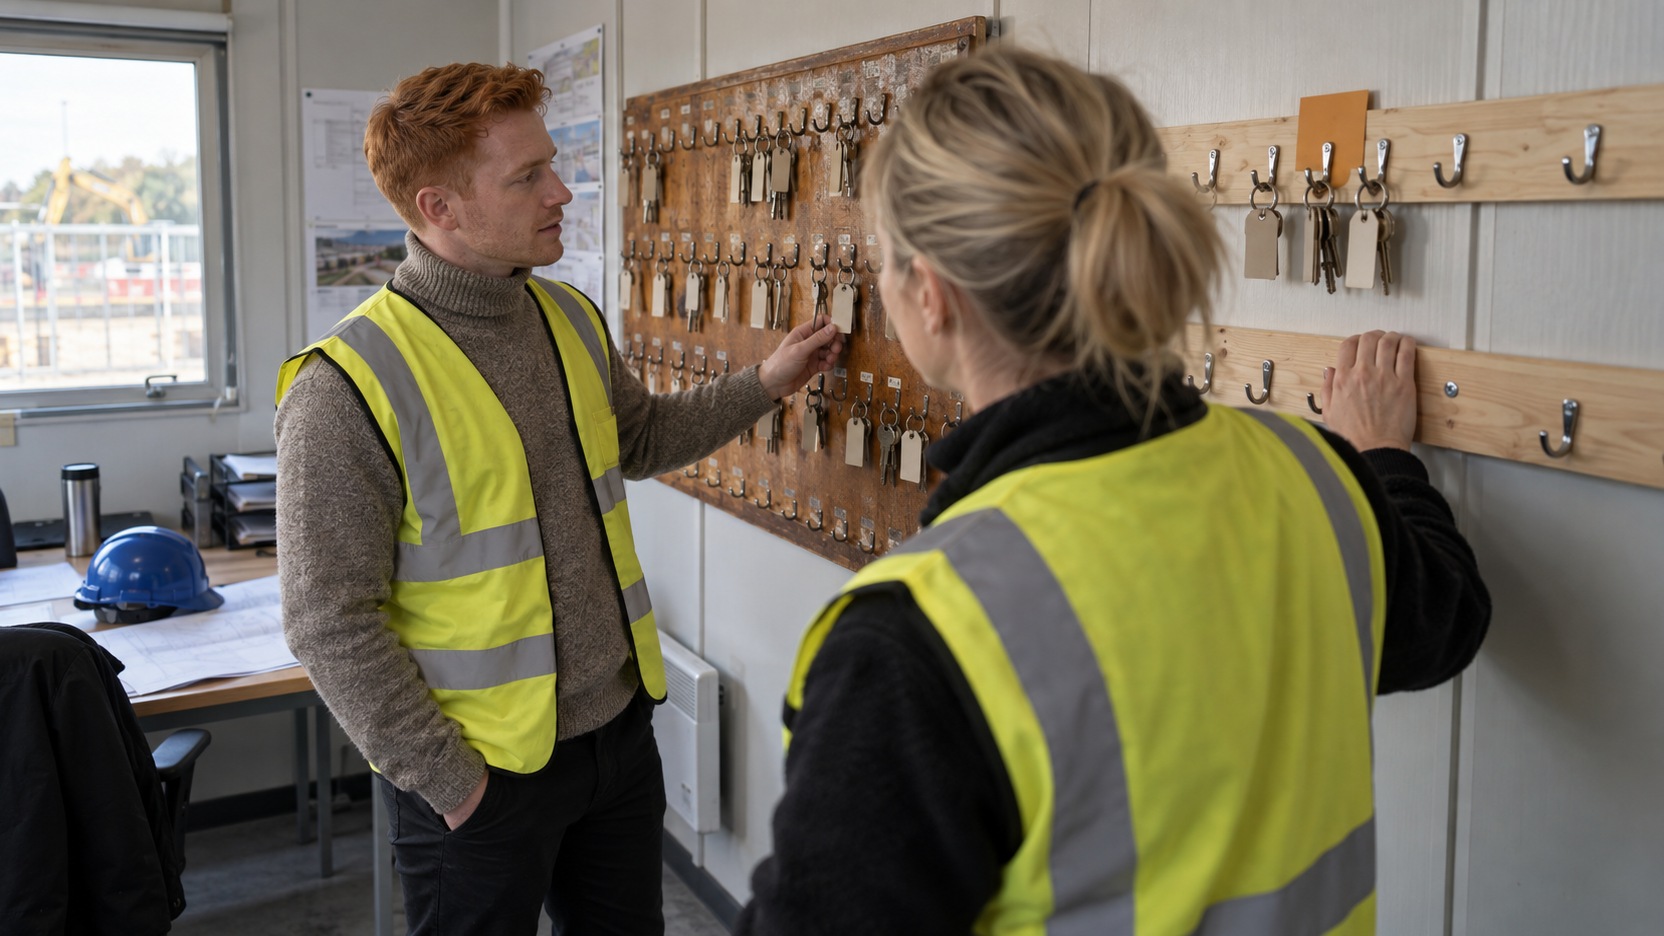
The site cabin acquired a physical version of the same story. The key board for commissioning permits ran out of hooks and somebody screwed a second rail of plain timber beside it, unpainted and longer than the original, which made the growth of the job visible to everybody who walked in.
Choosing between them
Use a burn-down where the total is genuinely fixed and the horizon is short. Inside a committed cycle, where the content is protected, the single line is simpler and nothing is being hidden by it.
Use a burn-up everywhere else, and always for anything reported to stakeholders. Any horizon long enough for scope to move needs the total made visible, and the moment somebody outside the team is reading the chart, the ability to distinguish delivery from scope growth stops being a nicety and becomes the point of the chart.
For a PMP® candidate, the practical reading is that a single line cannot separate delivery from scope change, so a scenario about flat progress with an active team is asking what happened to the total. A response that addresses team performance has accepted one of two possible readings without testing it. Situations where the chart is accurate and its shape is being misread come up repeatedly in a structured PMP exam preparation course.
Take whatever progress chart you currently issue and ask whether a reader could tell, from it alone, that scope had grown by fifteen per cent. If the answer is no, the chart is capable of misleading the person who trusts it most, and adding the total as a second line takes about ten minutes.
Interested in going further?
Progress charts are read by people who were not in the room, which makes what they leave out as consequential as what they show. Omega's PMP® Exam Preparation works through progress reporting that separates delivery from scope movement.
Progress tracking techniques of this kind are described in the PMBOK® Guide Eighth Edition.
Ad · Amazon affiliate link.
References
A119: How to Read a Burn-up Chart in a PMP Scenario
A177: Five Whys vs Fishbone Diagram
A180: Facilitation Techniques for Difficult Project Conversations
A161: Expected Monetary Value Explained
A191: Product Backlog vs Sprint Backlog
PMP and PMBOK are registered marks of the Project Management Institute, Inc.